
The Maryland Department of Transportation is in the process of soliciting proposals from private sector developers to design, build, operate and finance the construction of additional lanes on I495 and I270 highways in Maryland. These additional lanes will be developed as “managed lanes”, i.e., toll lanes where certain high occupancy vehicles are allowed to use for free. Details about the P3 program can be found at the project’s website.
This page provides traffic data for the I495/I270 highways, along with data on connecting arterials and local streets. Only data for the roads in the State of Maryland is shown. Please note that some road sections have data missing for certain years and, thus, you may notice some missing road sections in the charts. Data shown is from the Maryland State Highway Administration.
I495
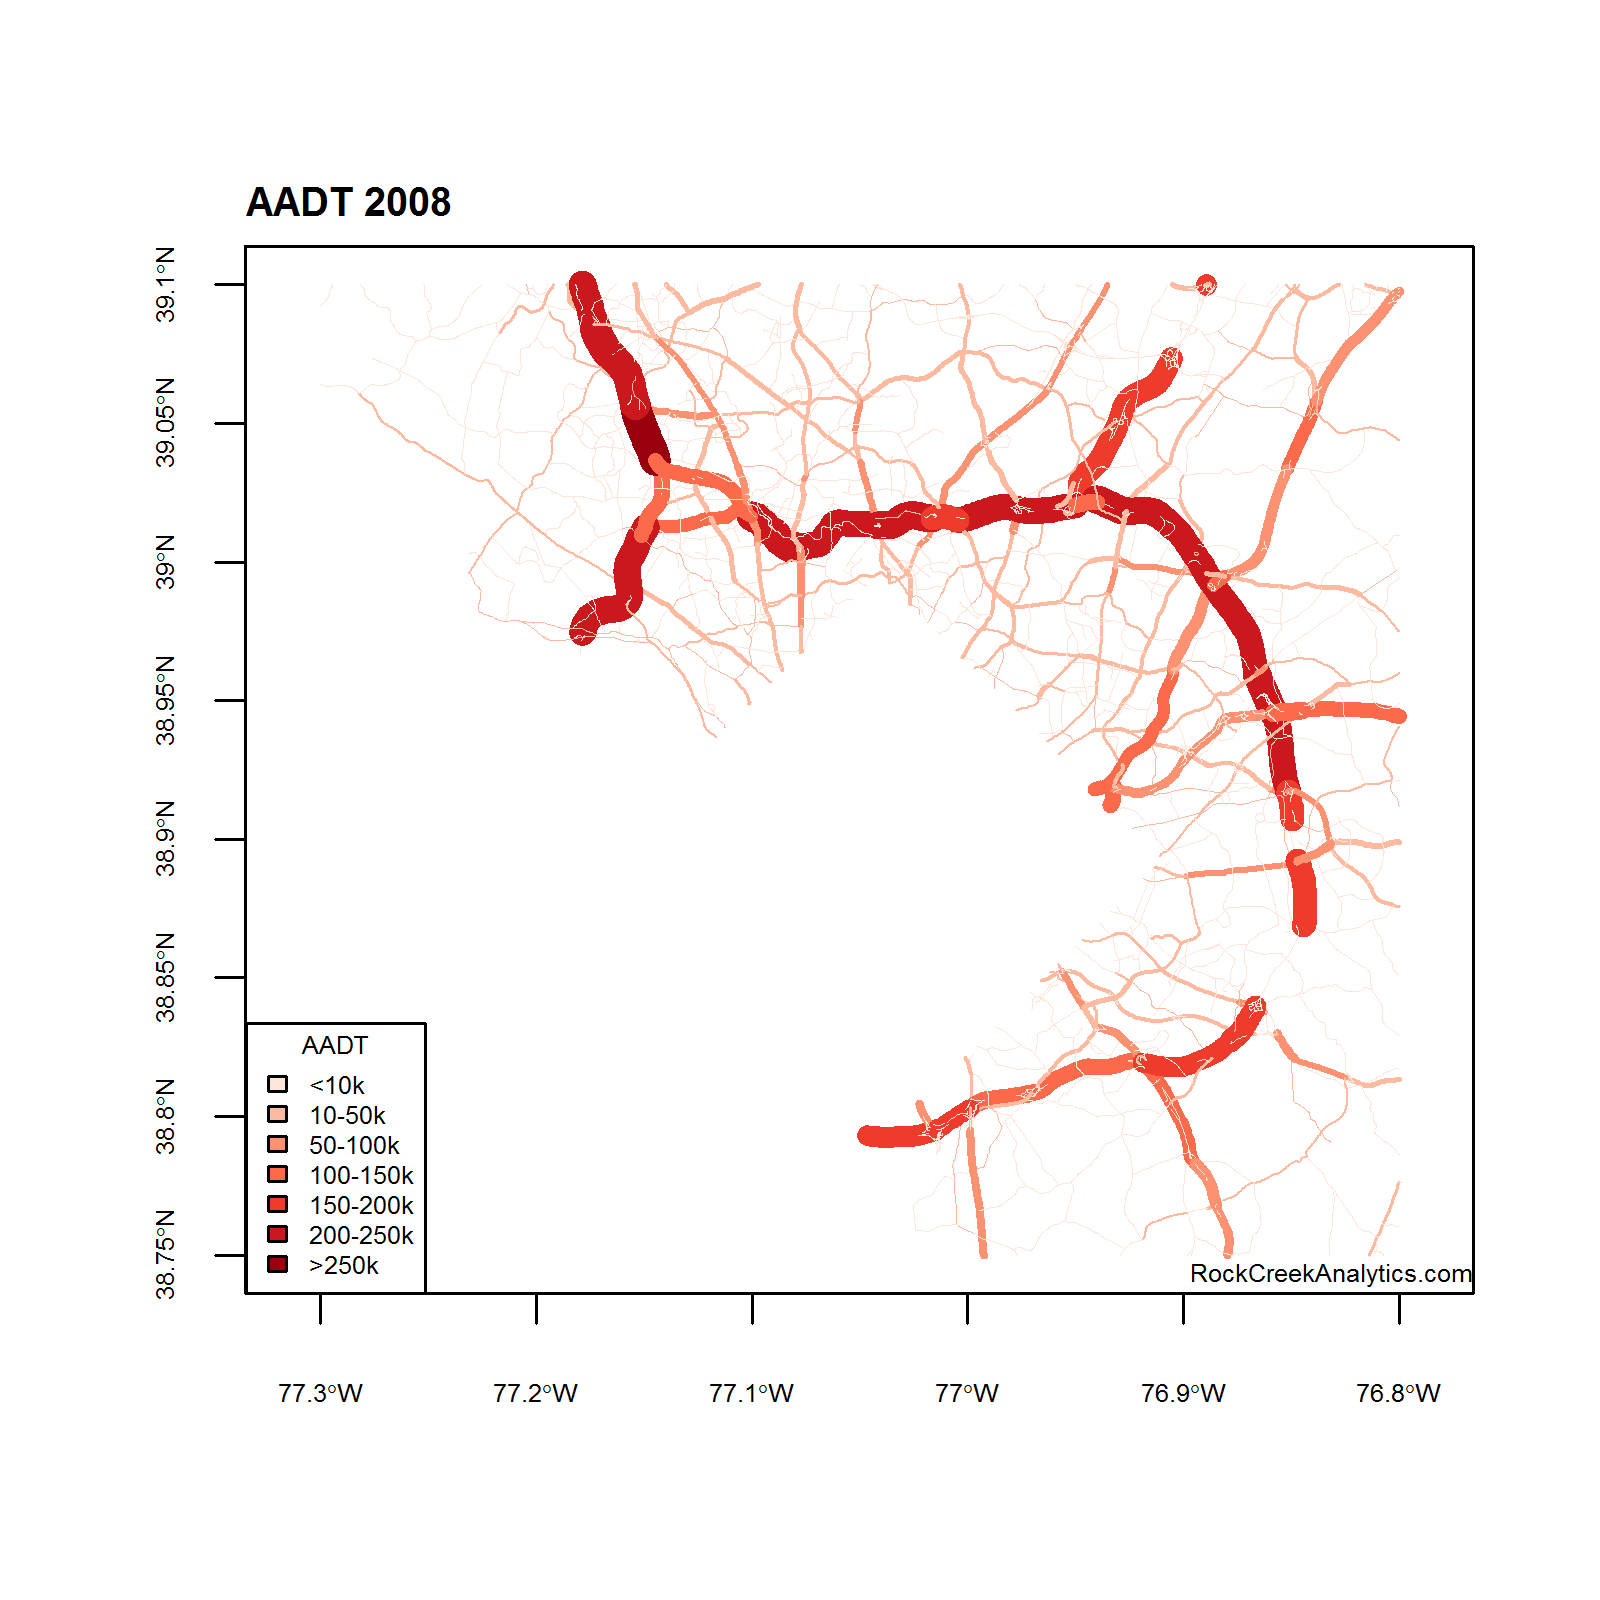
Traffic on most sections of I495 range between 200,000 and 250,000 vehicles per day (AADT). Over the past ten years, the growth on these sections has been minimal indicating saturation level traffic conditions. The following charts provide more detail on the traffic levels on I495.
Average Annual Daily Traffic
Traffic levels (AADT) for the years 2008 to 2017 are shown below.
 ‘
‘
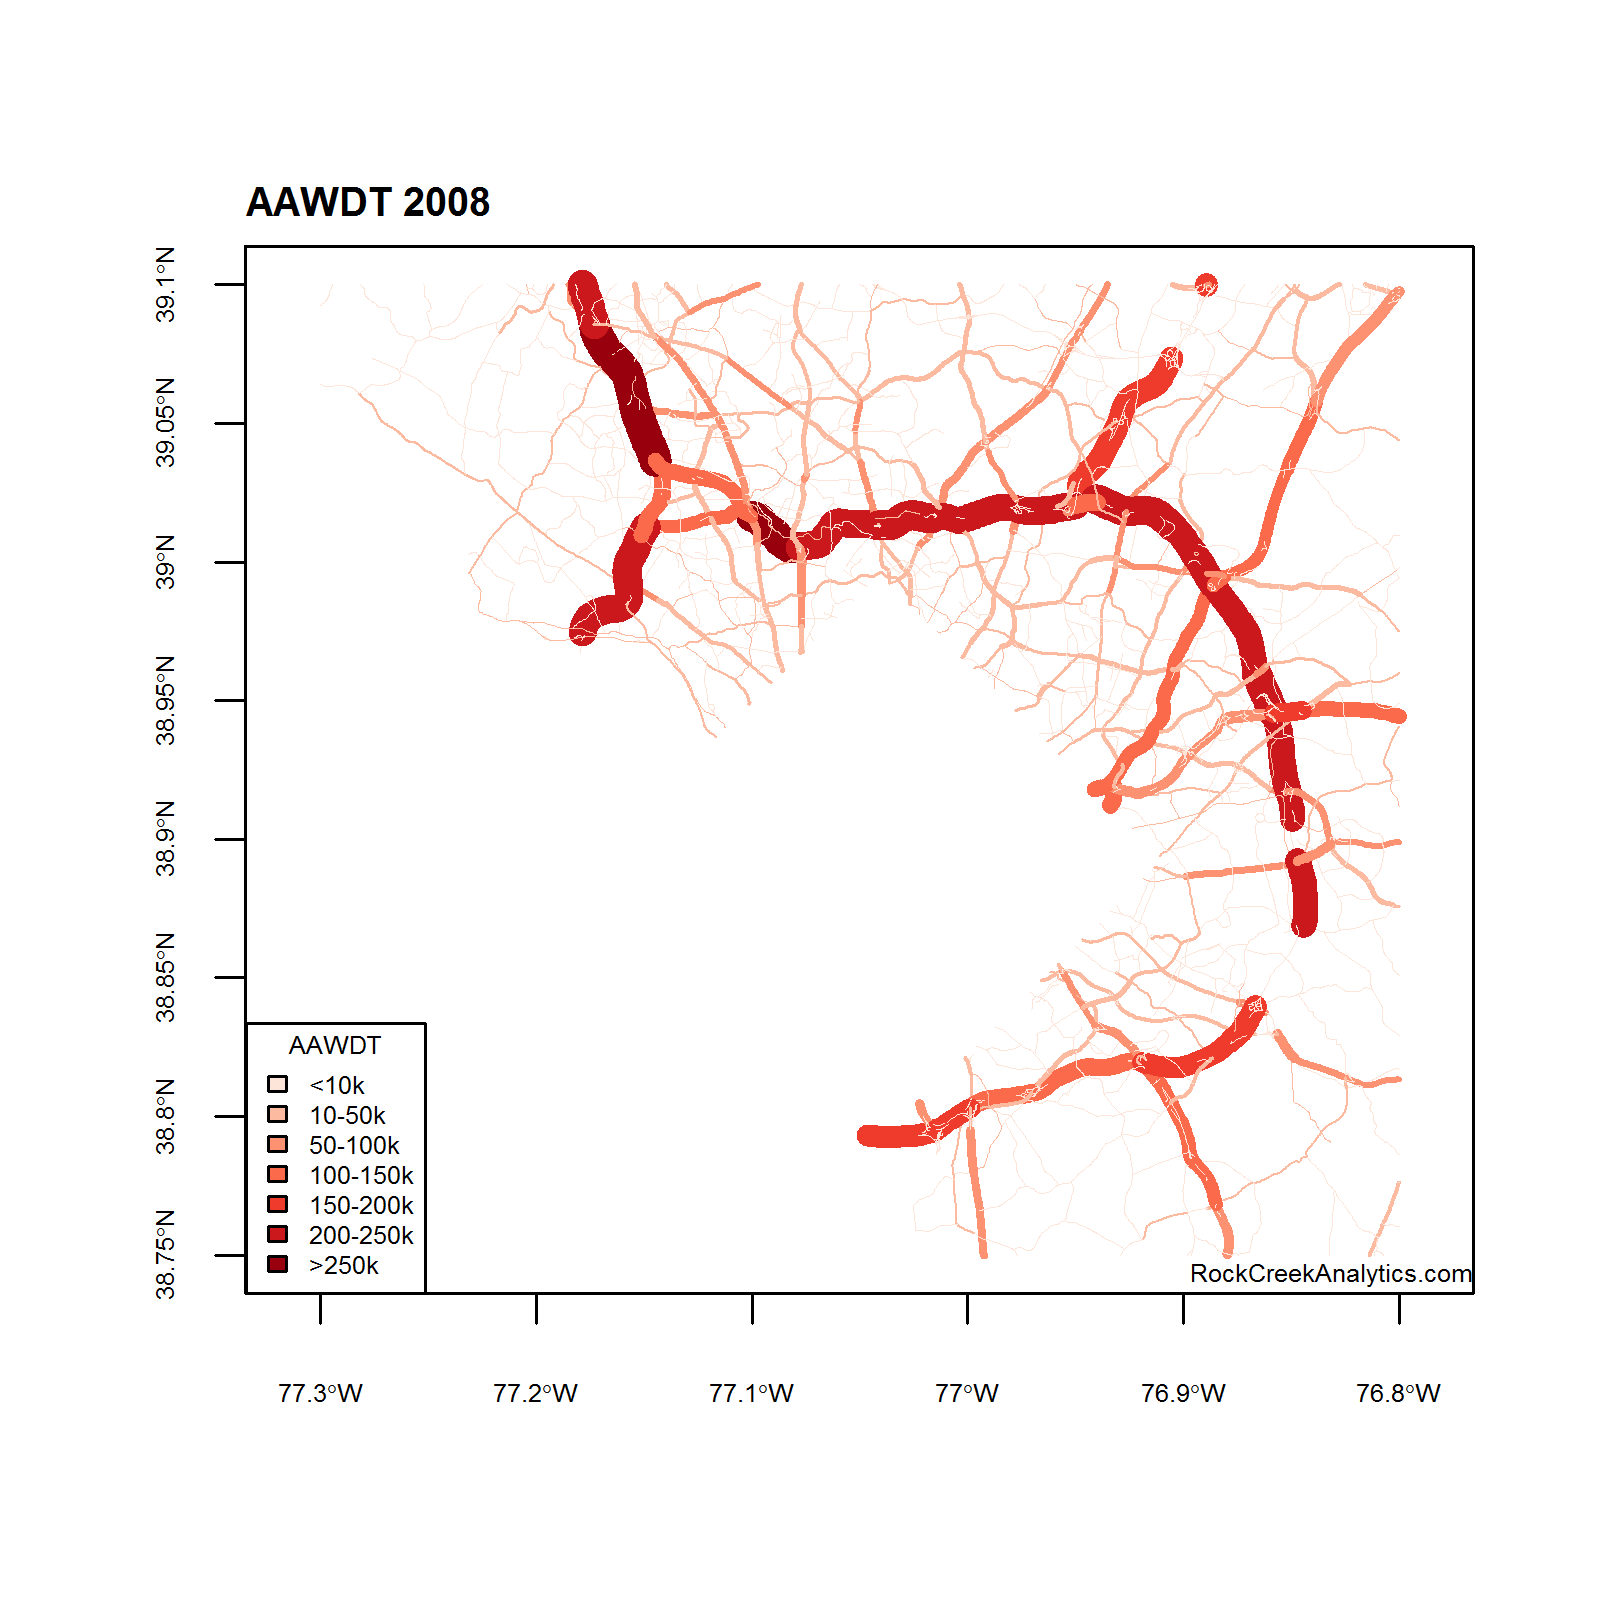
Average Annual WeekDay Traffic
Traffic levels (AAWDT) for the years 2008 to 2017 are shown below.
 ‘
‘
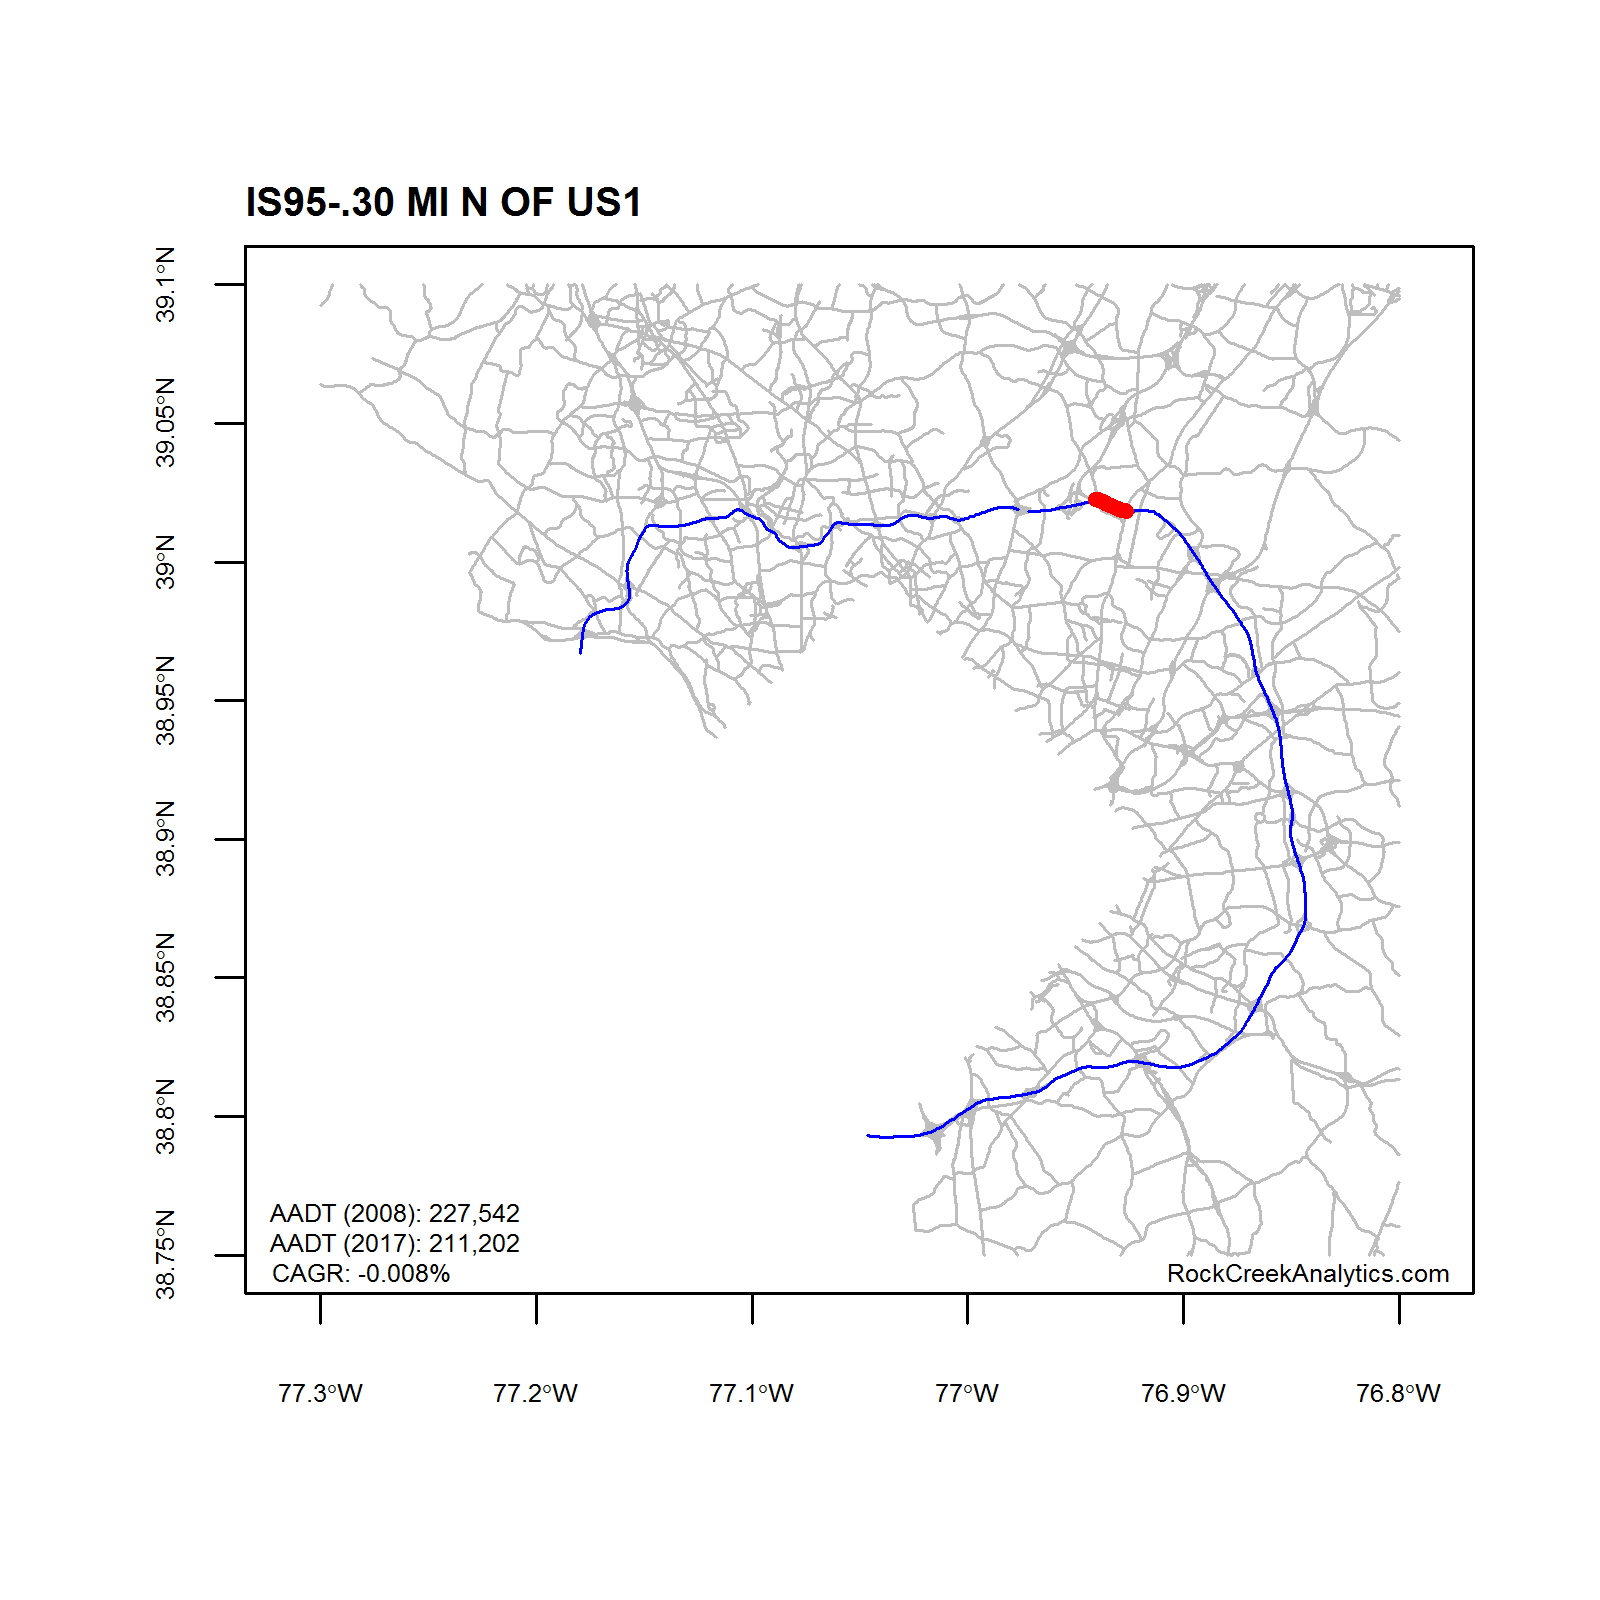
Traffic on Individual Sections
Traffic levels (AADT) for different sections of I495 are shown below. The growth rate (CAGR) from 2008 to 2017 is shown in the figure. CAGR: Compound Annual Growth Rate.
 ‘
‘
I270
Traffic levels on I270 range from 130,000 to 270,000 vehicles/day (AADT). Like I495, the growth over the past 10 years has been minimal. The opening of Intercounty Connector (MD200) – a toll facility connecting I270 with I95 – allowing an alternative route to I495 has had some effect of reducing traffic on the southern section of I270 and also I495 between I270 and I95. The following charts provide more detail on the traffic levels on I270.
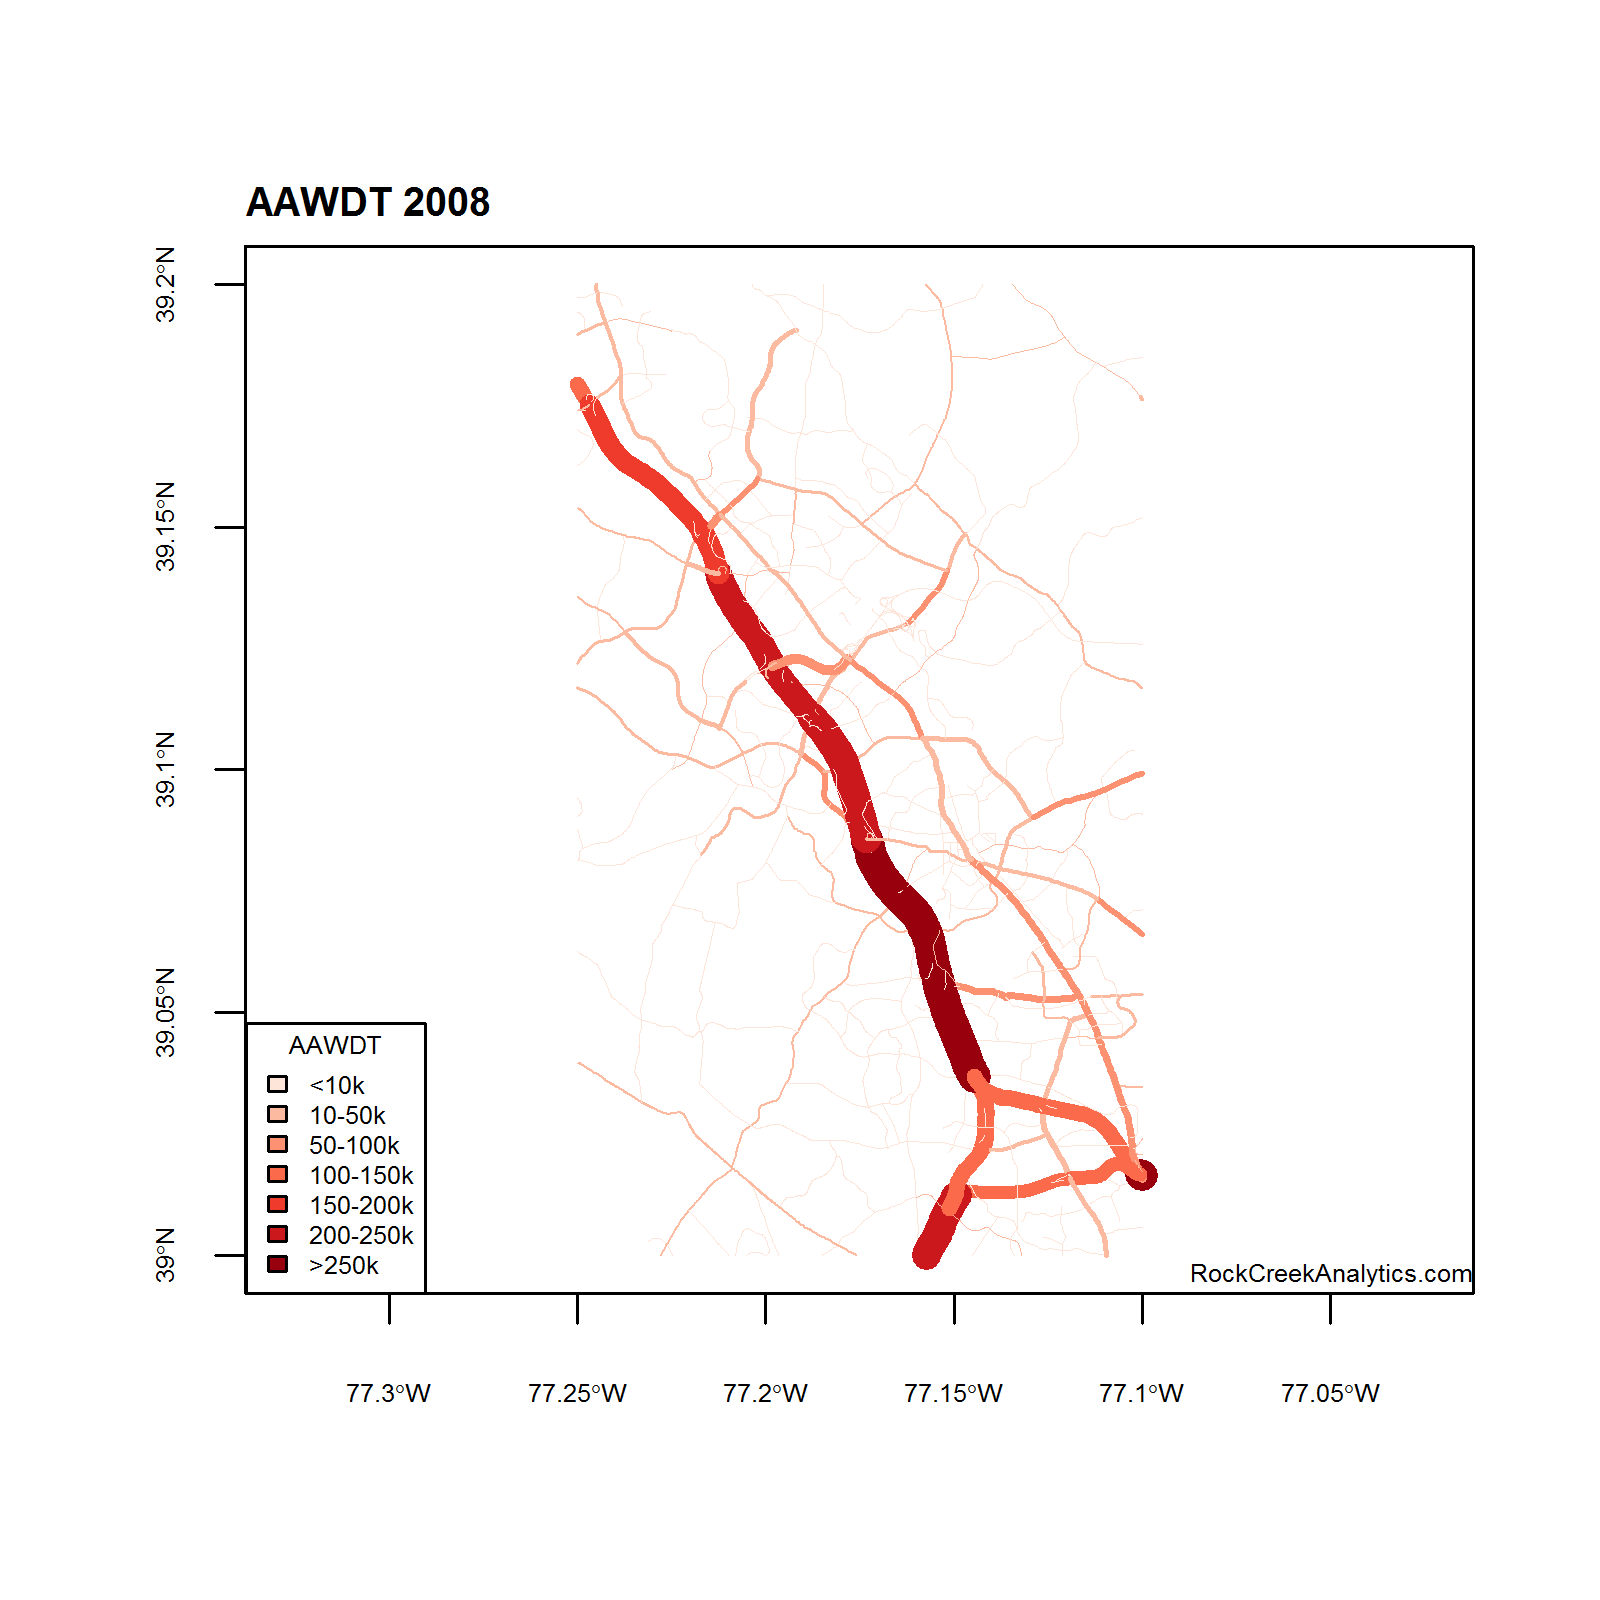
Average Annual WeekDay Traffic
Traffic levels (AAWDT) for I270 for the years 2008 to 2017 are shown below.
 ‘
‘
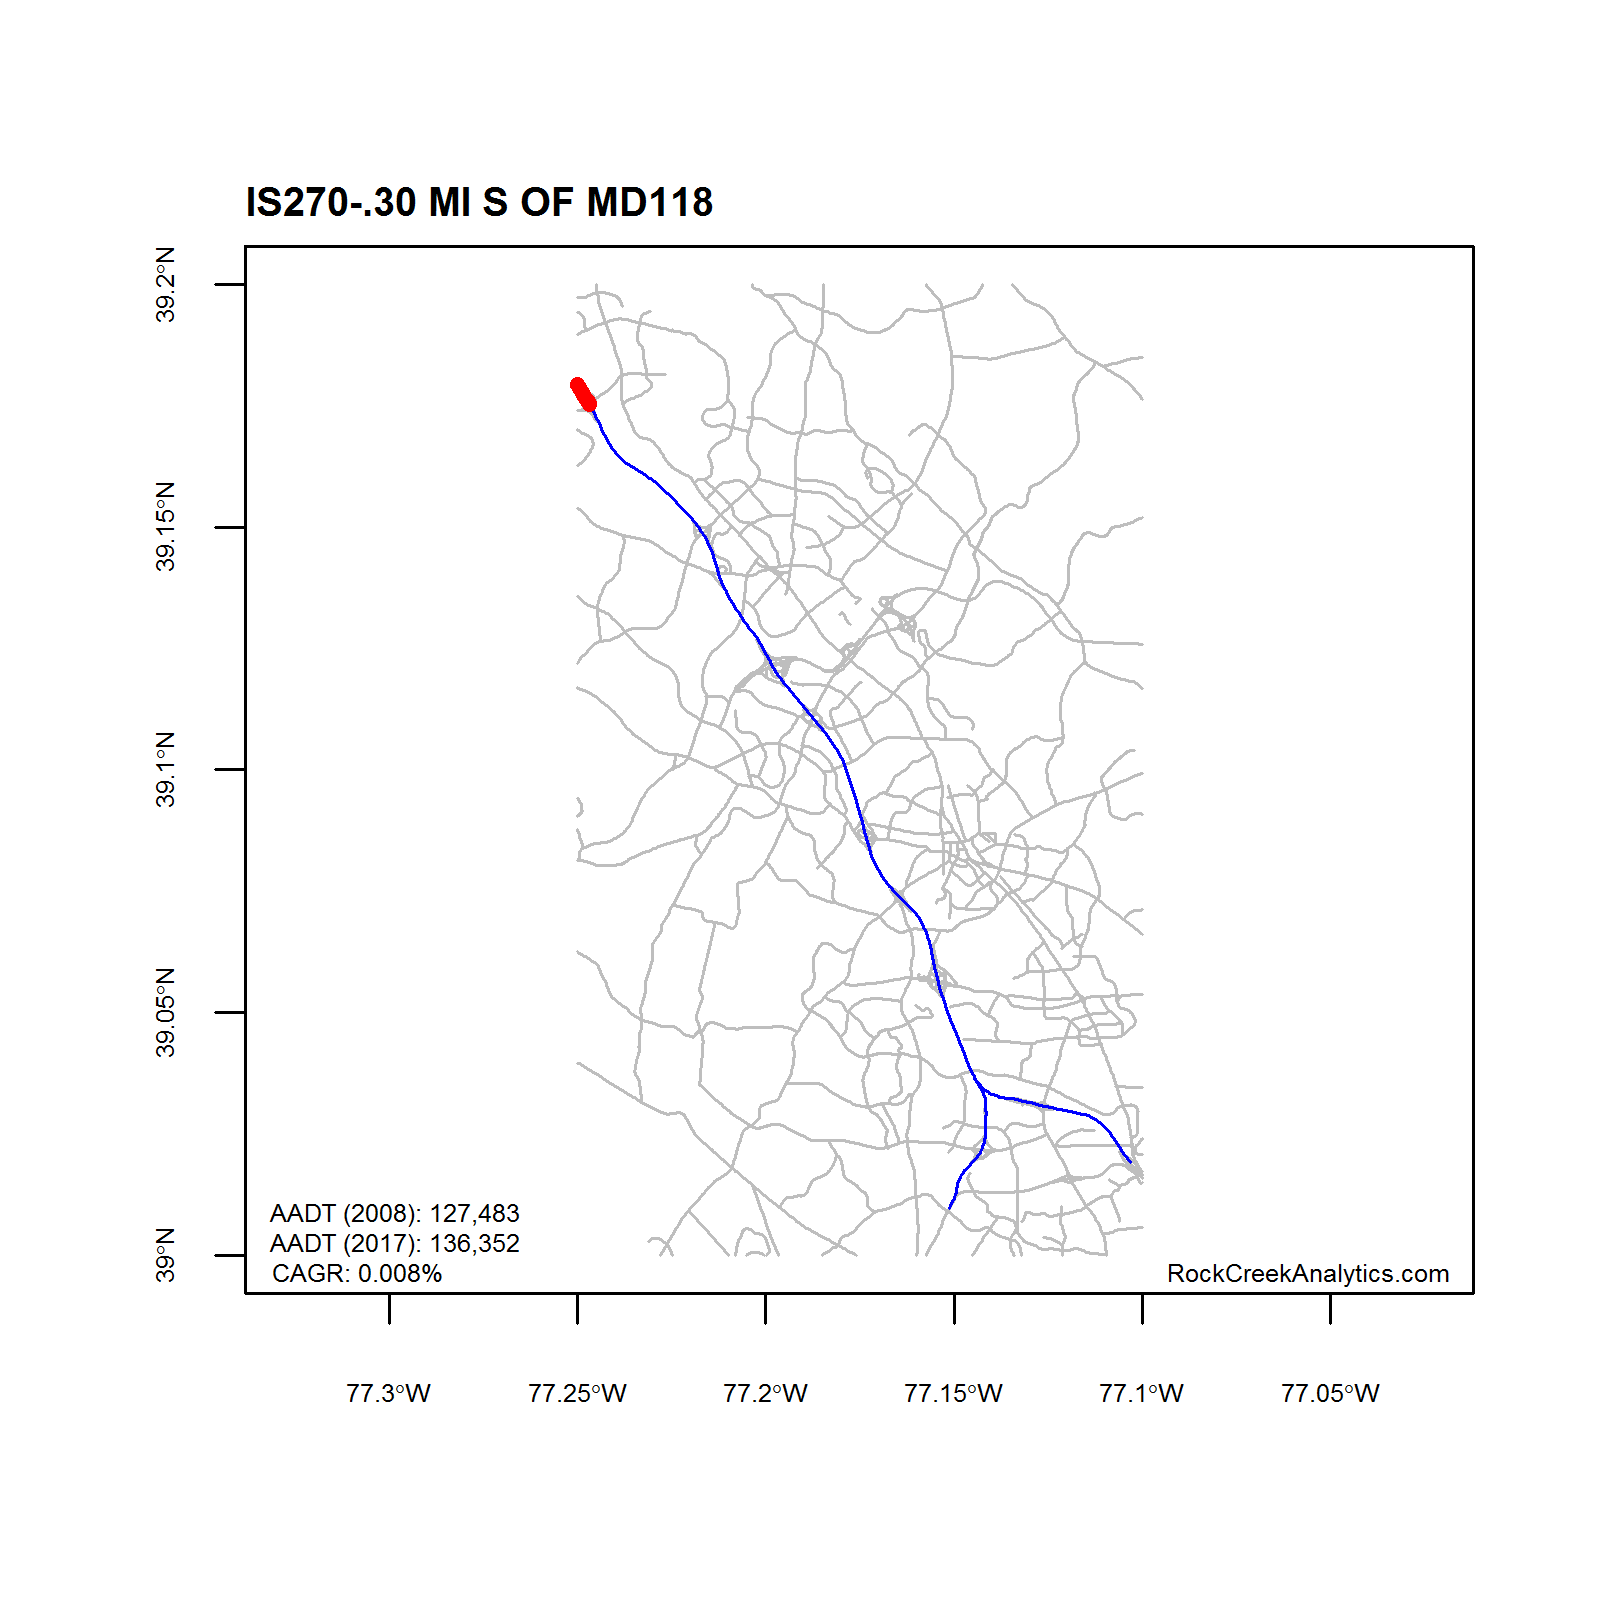
Traffic on Individual Sections
Traffic levels (AADT) for different sections of I270 are shown below. The growth rate (CAGR) from 2008 to 2017 is shown in the figure. CAGR: Compound Annual Growth Rate.
 ‘
‘
Get the data used in the charts shown above in Excel format.
- Use at your own risk. We make no representations or warranties about our analysis, especially any forecasts. All forecasts are likely to be inaccurate (to some degree) and may not materialize in the future.
- The analysis shown on www.RockCreekAnalytics.com (the Website) was done by Rock Creek Analytics, LLC, using data from Maryland State Highway Administration (SHA). We cannot vouch for the accuracy of data from Maryland SHA and we did not undertake any independent verification of the SHA data. If there are errors in the SHA data, then our analysis will have the same errors.
- None of the analysis shown on this Website can be taken as an endorsement of any financial transaction or used in support of any financial transaction. We will not be held liable or responsible for any decisions that any party makes using data from this page.
- None of our analysis including tables and figures shown on this Website can be reproduced, copied or modified without explicit written permission of Rock Creek Analytics, LLC.
- We reserve the right to withdraw or amend this Website, and any service or material we provide on the Website, at our sole discretion without notice. We will not be liable if for any reason all or any part of the Website is unavailable at any time or for any period. From time to time, we may restrict access to some parts of the Website, or the entire Website, to users, including registered users.